


题文
Last year, some groups of students in their community made a survey (调查) about “How do people spend their free time? ” The following diagrams(图表) show some results(结果) of it:
Diagram (1): Hours for people of different ages who search the Internet in a week.
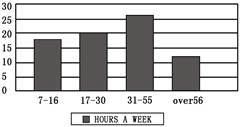 |
Diagram (2): Different days people go to the library. (library attendance出席)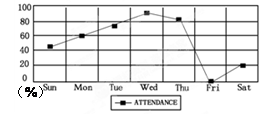
Diagram (3): Different programs (节目) people like.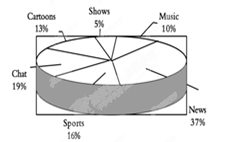
| A.7-16 | B.17-30 |
| C.31-55 | D.over 56 |
| A.About 20% | B.About 60% |
| C.Over 80% | D.More than 40% |
| A.Cartoons | B.Sports |
| C.News | D.Music |
| A.what people do every day | B.people’s different habits |
| C.people’s different lifestyles | D.how people spend their free time |

 粤公网安备 44130202000953号